

We logged 65,116,344 requests from seven AI crawlers across 38 of our own websites between October 2025 and July 2026. The headline result upends the popular story.
On a normal content site, OpenAI now reads pages into live ChatGPT answers roughly as often as it crawls them for training. Most published AI crawler statistics are someone else’s panel data retold. These numbers are our own.
At Mostash, AI search is the whole job. We run an AEO (answer engine optimization) and SEO agency alongside a network of our own web properties, the 38 sites in this study included. These are our Cloudflare logs, not a vendor deck.
Every claim below is reported with and without our known outlier site. Every relational claim had to hold in both halves of the study before it earned a place here.
Before publishing, we tried to kill every headline in this piece. Two of our best died in robustness checks, and the morgue is published in full below.
Key takeaways
- Track ChatGPT-User fetches as your AI-visibility KPI. On content sites, live reads roughly match training crawls (typically near 1:1).
- Answer bots pull reviews, roundups, and comparisons into live answers far more than guides.
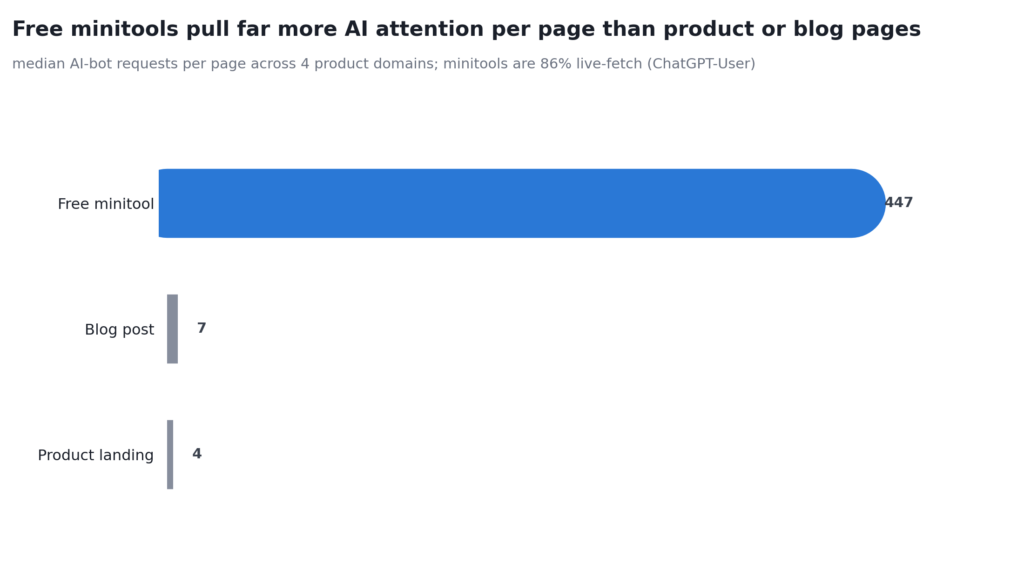
- Free indexable minitools are AI-answer magnets, a typical 447 requests per page against 4 for product landing pages.
- Audit per-bot error rates. One of our biggest sites silently lost 46% of ClaudeBot requests to 5xx.
- AI reads far beyond your Google surface, while 99.3 to 100% of Google clicks land on AI-crawled pages.
Here is what we measured, and how to read it.
The Dataset in One Table: Seven AI Crawlers, Nine Months, 38 Sites
OpenAI is the company you optimize for and the one you must never accidentally block. When you plan for AI crawlers in 2026, you are mostly planning for one company’s three bots, each doing a different job on your pages.
Its dominance in our logs is not close:
- OpenAI’s three bots (GPTBot, ChatGPT-User, OAI-SearchBot) account for 94% of pooled AI-bot traffic in our corpus
- 78% after excluding our outlier site
- 73% on the typical site
Every other provider combined is a rounding error next to that.
To keep our portfolio private we label individual sites by role and volume, C for content sites, T for tools, P for products; the bots, the metrics, and the totals are all exact.
What the codes mean
The sites stay private, but here is what each cited code actually is, so the numbers have a shape you can judge. C is a content site, T a tool, P a product; the number orders them by AI-bot volume.
| Code | What it is |
|---|---|
| C01 | A large ecommerce-software and website-builder review site, around 2,000 articles. |
| C02 | An ecommerce and print-on-demand how-to blog, several hundred articles. |
| C05 | An ecommerce how-to and product-review blog, a couple of hundred articles. |
| P02 | An AI tutoring web app (a recent AI-era product). |
| P03 | An AI study product with free homework and math helper tools (recent). |
| P05 | An AI note-taking and study product (recent). |
| P06 | An AI homework-help product (recent). |
| P07 | An AI consulting and education-product site. |
| T01 | A free online text-summarizing tool, long-established and high-traffic. This is the outlier that the training crawler hits hardest. |
One site has to be named before any average gets quoted. T01, a summarization app in our own portfolio, generated roughly 80% of raw corpus volume by itself.
A single app can bend every pooled statistic, so we report claims both with and without it. The headline claims in this piece use the excluding-smmry or typical-site figures.
The corpus total of 65,116,344 requests stands as the study size either way. What changes with the outlier is every average you compute on top of it. The table below uses excluding-outlier totals, one row per crawler.
About this data
- 65,116,344 Cloudflare-verified AI-bot requests
- 38 websites, all in our own portfolio
- Window 2025-10-17 to 2026-07-07
- Instrument was Cloudflare’s verified-bot classification
- Pre-registered design. We wrote every prediction down before running the numbers, then tested each one in two separate time periods. Averages reported with and without the 80%-of-volume outlier.
The full methodology sits near the end of this page, and the aggregated data is openly downloadable under CC BY 4.0.
| Crawler | Requests (excl. outlier) | Role | Share (excl. outlier) | Reached a live page (2xx) | Median days to find new content |
|---|---|---|---|---|---|
| ChatGPT-User | 4.9M | Live answer fetch (OpenAI) | ~38% | 94.1% | 1 |
| GPTBot | 3.6M | Training crawl (OpenAI) | ~28% | 38.6% | 2 |
| ClaudeBot | 2.6M | Training crawl (Anthropic) | ~20% | 50.1% | 7 |
| OAI-SearchBot | 1.7M | Search indexing (OpenAI) | ~13% | 62.9% | 1 |
| PerplexityBot | 251k | Search indexing (Perplexity) | ~2% | 84.9% | 1 |
| Applebot-Extended | 41 | AI training control (Apple) | <0.01% | 46.3% | n/a |
| Google-Extended | 1.9k | AI training control (Google) | 0.01% | 4.4% | n/a |
Source: our first-party Cloudflare bot logs; 2xx shares are whole-corpus. Full dataset linked above.
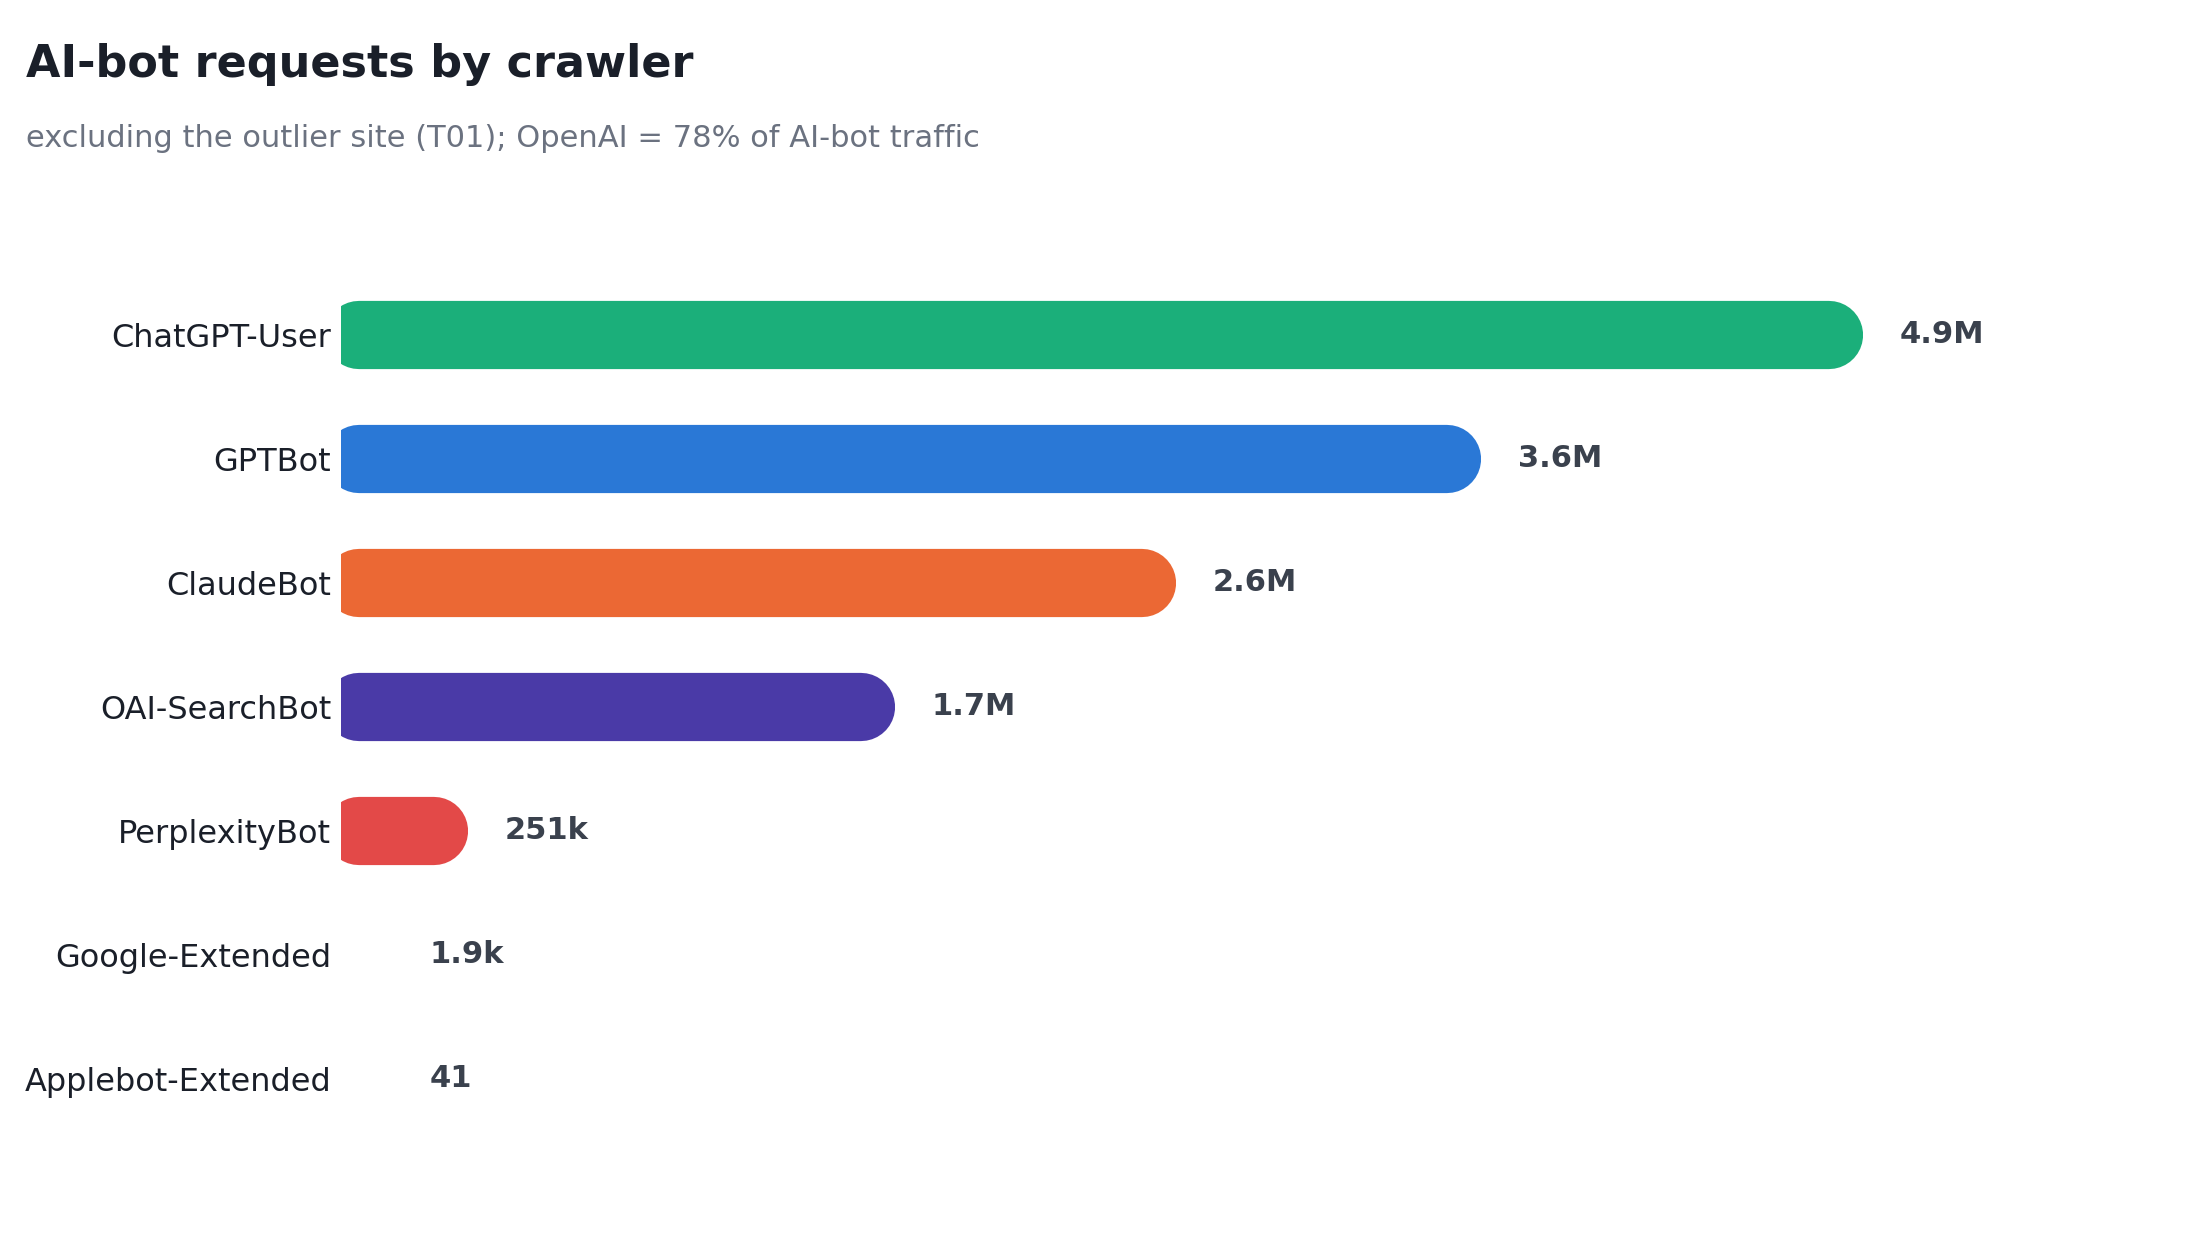
The split that runs through every finding below is role, not volume:
- GPTBot and ClaudeBot are training crawls. They collect pages so future models know things.
- ChatGPT-User is a user-triggered live fetch. It hits your page at the moment a real person asks ChatGPT a question your page can answer.
- OAI-SearchBot indexes for ChatGPT’s search layer, and PerplexityBot does the equivalent for Perplexity.
The two Extended tokens exist mainly as training opt-out controls rather than working fetchers, which Google-Extended’s 1.9k requests and Applebot-Extended’s 41 make plain.
Watch how differently the training crawls and the live fetches behave, because that difference is the study.
1. Track AI Reads, Not AI Crawls: ChatGPT-User Is the KPI
Make ChatGPT-User hits your AI-visibility KPI, and keep every URL it fetches fast and 200-clean. That is the single measurement change this dataset argues for hardest.
*This is one of our strongest results. It held with and without the outlier, in both halves of the study.*
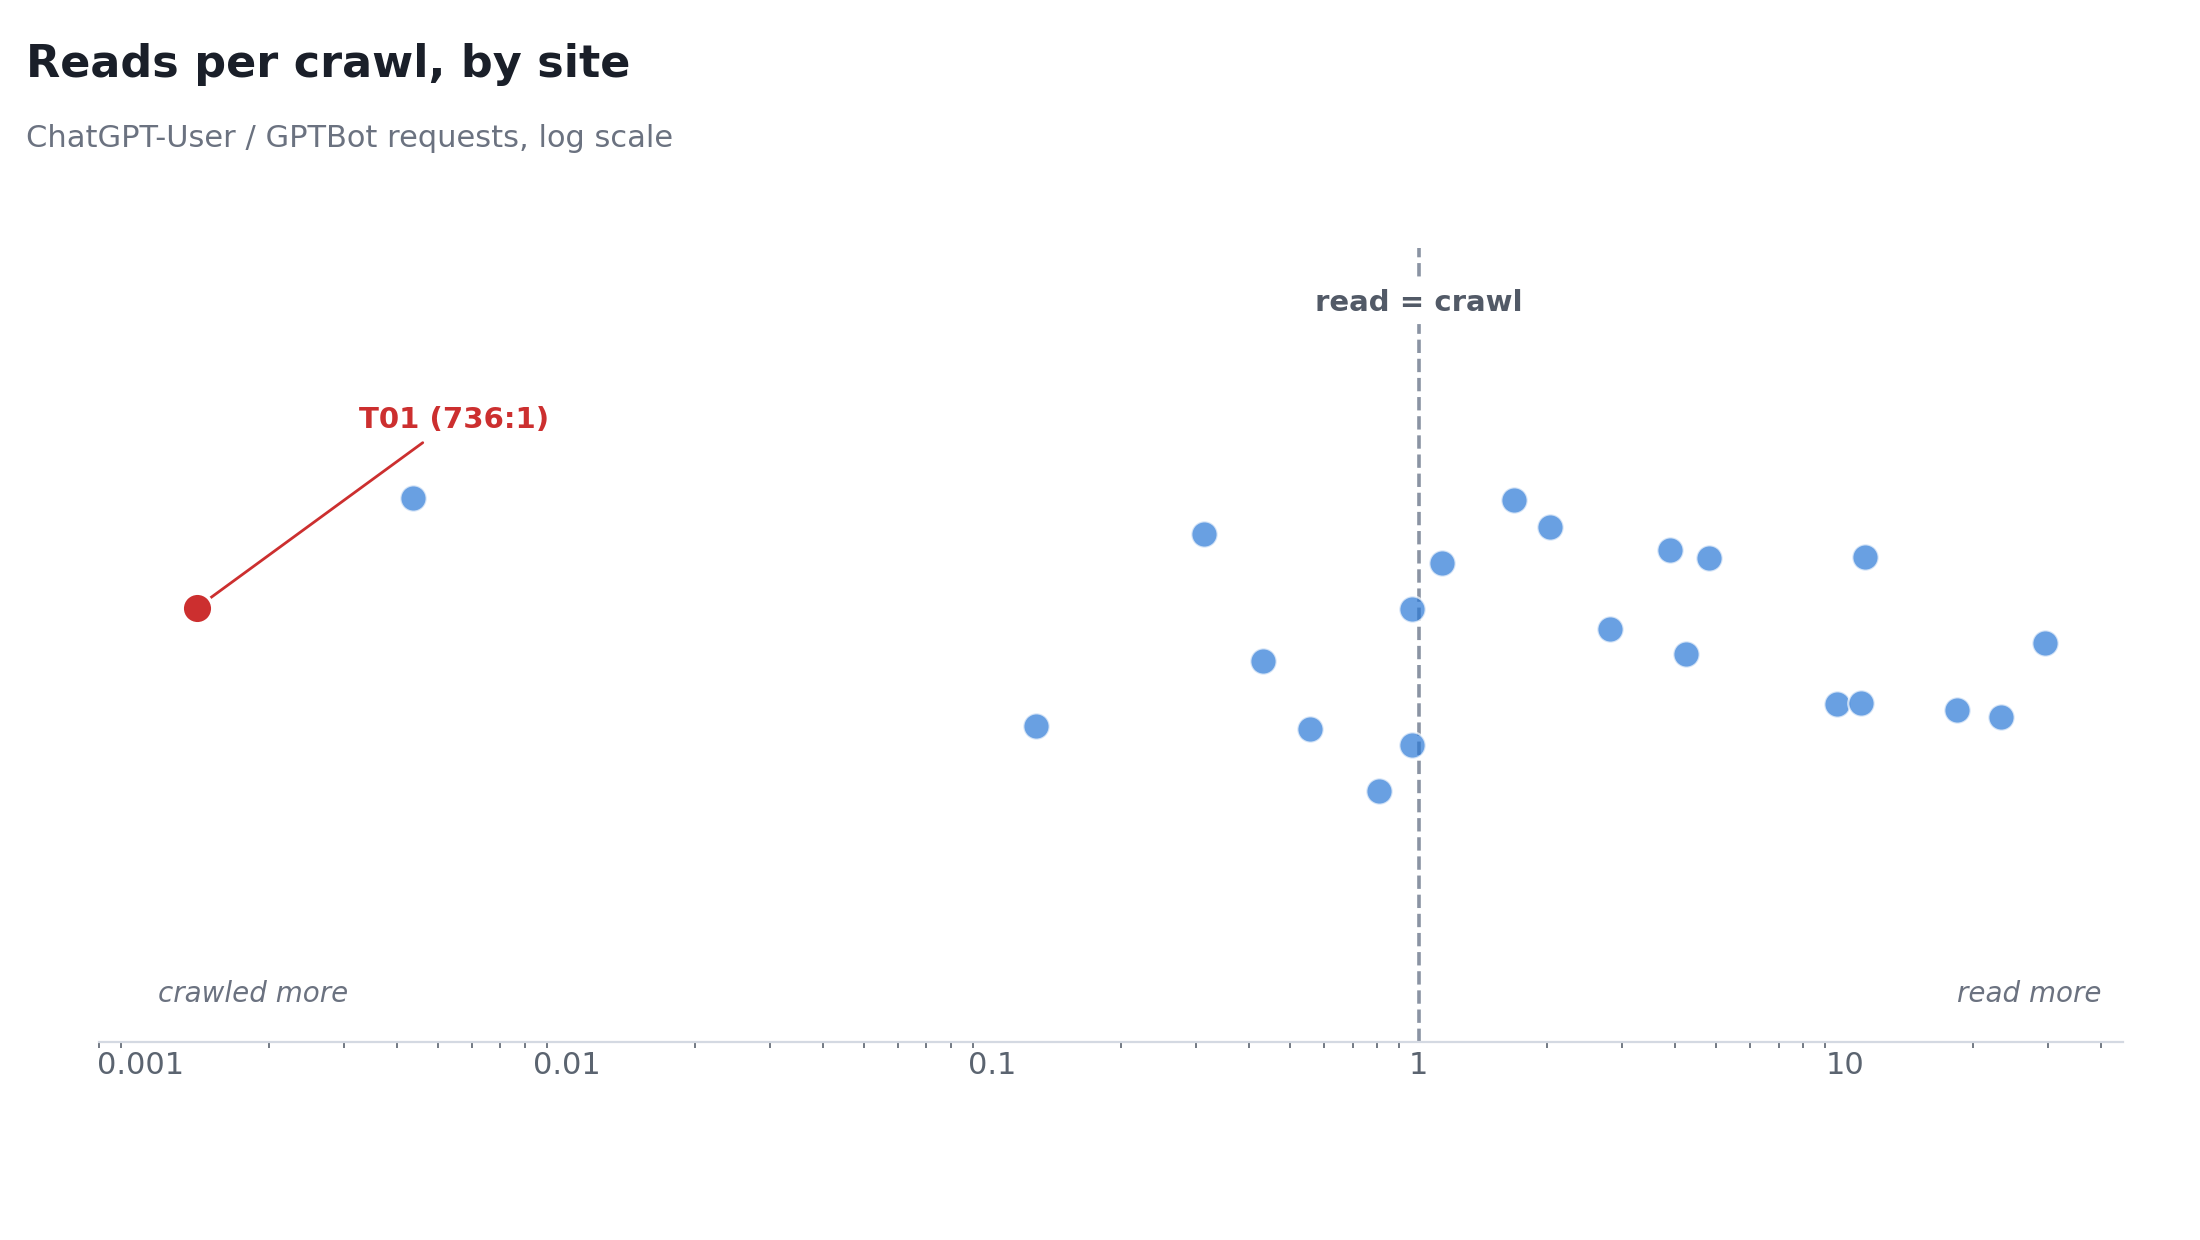
The viral claim that OpenAI crawls your site 11 times more than it reads it does not survive contact with per-site data. Our pooled numbers show that lopsided shape too, but the entire effect comes from one property:
- T01 runs at 736 training crawls per live read and bends the pooled ratio by itself
- Remove it, and the typical content site’s reads-per-crawl ratio lands near 1:1
- Several of our content sites take 10 to 25 reads per crawl, while app and utility sites run crawl-heavy
Your own ratio is worth computing rather than assuming. A pooled industry number, ours included, hides all of it.
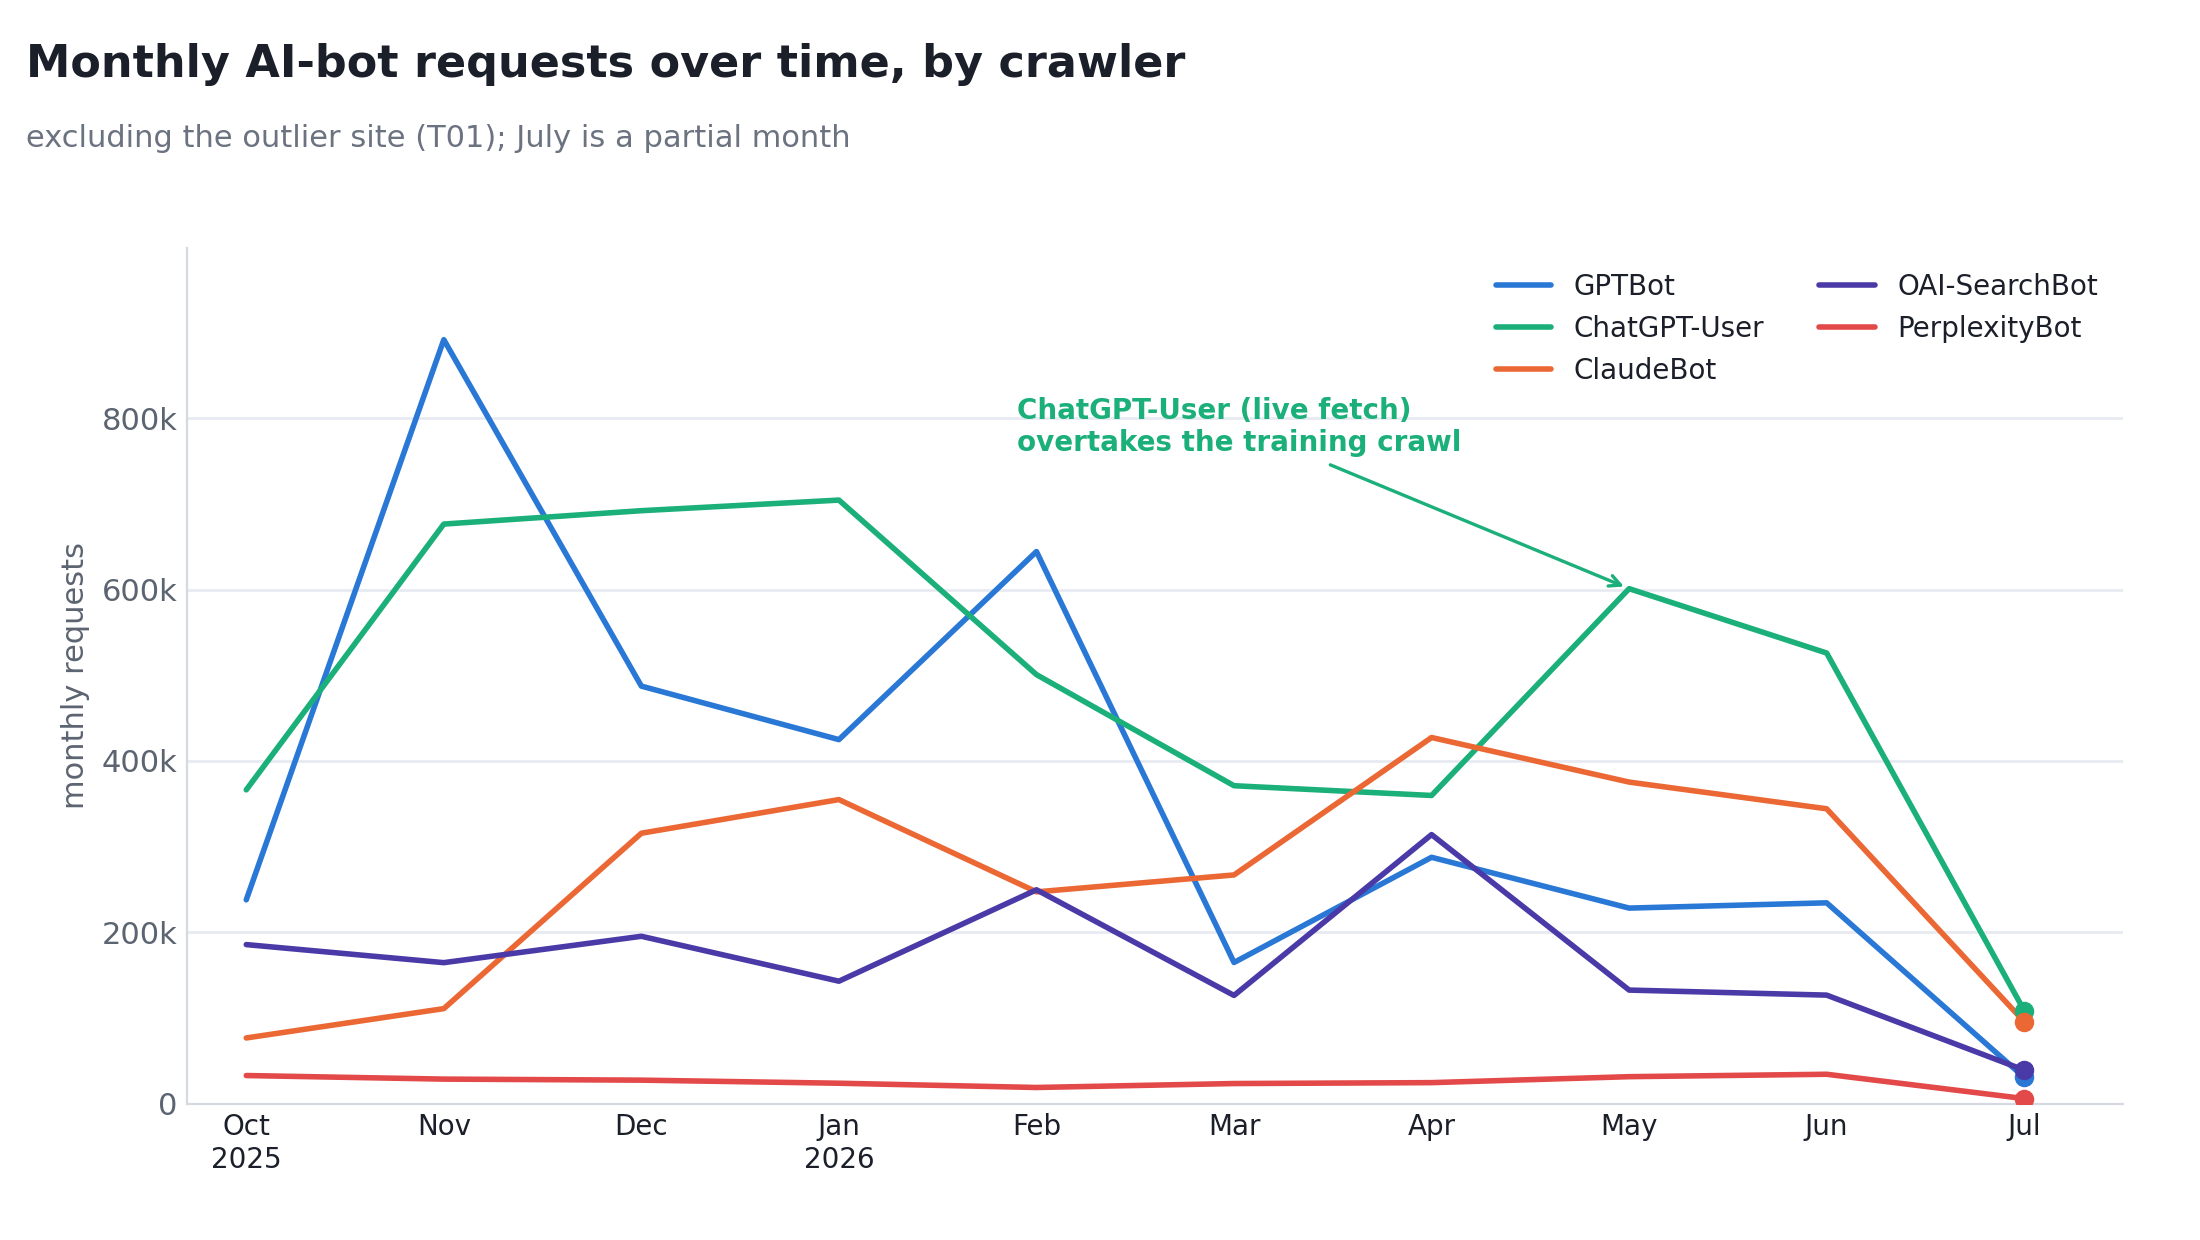
ChatGPT-User is also growing again in our AI crawler data:
- Monthly volume rose from 377k requests in March 2026 to 609k in May, outlier excluded
- In the monthly trend, the live fetch overtakes the training crawl
- It is the cleanest AI traffic we log, with 94 to 97% of requests returning 2xx, meaning they reached a live page
We expected the opposite. We wrote down a prediction (H5) that users would make assistants chase stale and hallucinated URLs, and the data reversed it in both halves of the study.
The training crawlers generate the mess; the live fetcher runs clean. The full account is in the misses section below.
Why this matters comes down to payoff timing. A training crawl may pay off someday, diffusely, inside a model’s weights. A live fetch is a real user getting your page pulled into an answer right now.
SEO got you ranked. AEO got you structured for answers. Retrieval gets you read, and retrieval is the layer you can win this quarter.
If you instrument one thing this month, segment ChatGPT-User in your CDN or server logs and watch it weekly. Track the count per property, split by status code.
Rising reads with clean 2xx responses is the healthiest signal in this entire dataset. Crawl totals flatter you. Reads tell you how often your pages are being pulled into live answers.
2. Answer Bots Crawl Reviews and Comparisons Far More Than Guides
For live-answer visibility, prioritize reviews, roundups, and head-to-head comparisons over another guide.
*This is one of our strongest results. The ranking came out identical in both halves of the study and held inside each large site on its own.*
Content teams keep shipping guides because guides are what a decade of SEO rewarded. The answer engines have different appetites.
We classified 2,703 posts across six of our content sites with a two-LLM pipeline (94% agreement between the models) and joined every page to its crawl log. The pattern:
- The requests-per-page ranking runs reviews first, then roundups, comparisons, and news updates in a cluster, then guides last among the major types
- Guides are our most-published format at 813 pages, yet a typical guide pulls roughly half the per-page attention of a review (100 requests against 250 in the first half of the study, 74 against 138 in the second)
- Reviews, listicles, and comparisons absorb 77 to 90% of each commerce site’s total AI crawl (C01 78%, C02 77%, C05 90%)
Guides still hold a meaningful absolute share on the big sites, 19% on C01 and 23% on C02, because there are so many of them. That attention is spread thin across hundreds of pages.
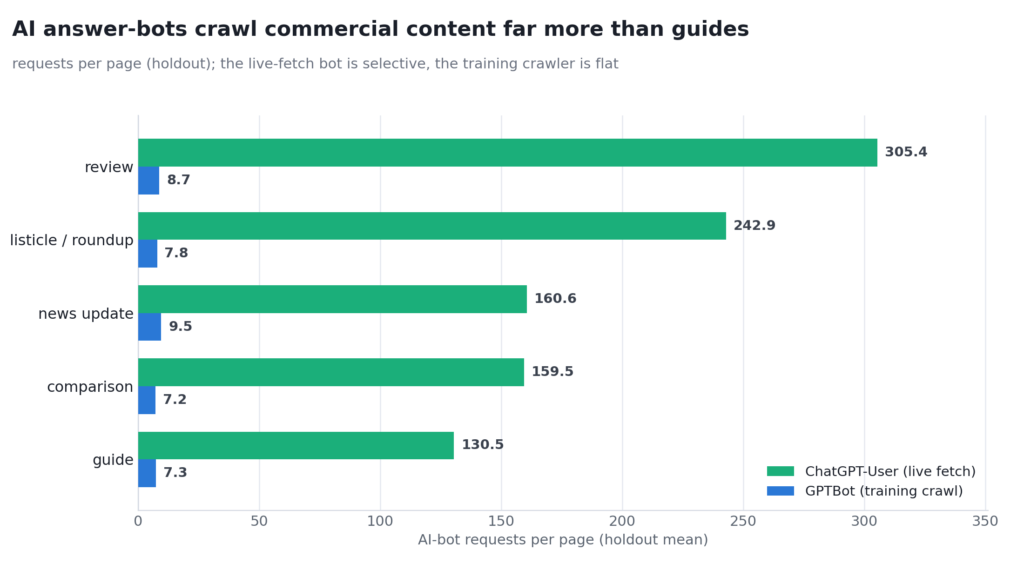
The per-bot split explains the gap:
- ChatGPT-User, the live-answer fetcher, hits a review roughly 2.3 times more per page than a guide (305 against 131 requests in the second half of the study)
- GPTBot, the training crawler, stays flat at roughly 5 to 10 requests per page across every type
- Strip ChatGPT-User out of the data and the type gap largely vanishes
The preference for commercial-comparison formats is an answer-engine behavior, not a general AI-bot behavior.
We checked the obvious trap. The ranking holds within each of our three large sites individually, so it is not a quirk of mixing different sites.
Two caveats. This measures crawl attention, not citations; we cannot yet observe which fetches end up cited in the answer text. And the classification carries roughly 6% disagreement, which adds noise at the type boundaries without plausibly moving gaps this large.
The read for your content calendar is short. A guide earns training-crawl coverage. A comparison earns live fetches. Publish the comparison, then let the guide support it.
3. Free Minitools Are AI-Answer Magnets
Free, indexable minitools out-pull everything else we publish for live-answer fetching, and it is not close. Treat solvers, calculators, and helper tools as first-class AI-visibility assets.
*Read this one as solid with caveats. The totals are unambiguous, but the sample is about 15 tool pages, so the exact per-page numbers are noisy even though the direction is clear.*
Product teams keep sinking their AI hopes into landing pages and gated apps that AI bots barely touch. Across four of our product domains (P03, P02, P05, P06), the gap is stark:
- The typical minitool drew 447 AI-bot requests per page
- The typical product landing page drew 4. The typical blog post drew 7.
- ChatGPT-User accounts for 86% of all minitool requests, at 41 reads per crawl, with 96.1% reaching a live page
When a user asks an assistant to solve a chemistry problem, it fetches a solver page into the answer in real time. The pattern repeats wherever a free tool exists:
- Our P03 math tutor page alone logged 2,872 AI requests, 2,686 of them from ChatGPT-User
- P02’s homework tool logged 1,407
- P05’s homework helper logged 245, with 174 from the live fetcher
Blog pages show the same live-fetch skew wherever a real library exists. Thin blogs lose most of it; P05 carries 7 posts.
Product landing pages are not ignored in total. They are our largest page class at 296k AI requests across 710 pages, but the attention is split into two extremes:
- Homepages and pricing pull enormous live-fetch volume. The P03 homepage logged 35,390 ChatGPT-User requests against 199 from GPTBot, and its pricing page is the busiest non-tool landing at 3,314 AI requests.
- The long tail of SEO landing pages sits at about 4 requests per page
- Gated app.* pages are a dead corner at roughly 1 request per page
A login wall is an AI-visibility wall.
One caveat repeats the note above. Our minitool sample is about 15 pages, 12 of them on one domain, so the totals are robust while the per-page figures are noisy. Read 447 as “a lot more than 4,” not as a precise multiplier.
Best for products that have, or could ship, a free tool surface. Skip if your only public surface is a brochure site; fix that first, and a free indexable tool is a good place to start.
4. Audit Your Per-Bot Error Rates: the Silent 5xx Leak
Pull per-bot 2xx, 3xx, 4xx, and 5xx counts from your server or CDN logs this week. It is the cheapest AI-visibility fix that exists, and almost nobody runs it.
*This is one of our strongest results. It is a straight count from the logs, on 65 million requests, with no modeling in between.*
We are blunt about this because it happened to us. On C01, one of our biggest sites, ClaudeBot lost 46% of its 755k+ requests to 5xx errors.
A server or WAF was silently failing an AI crawler at scale, for months, on a property we run professionally. If it happened on a portfolio we watch this closely, it is worth an afternoon to rule out on yours.
The spread across our logs is wide:
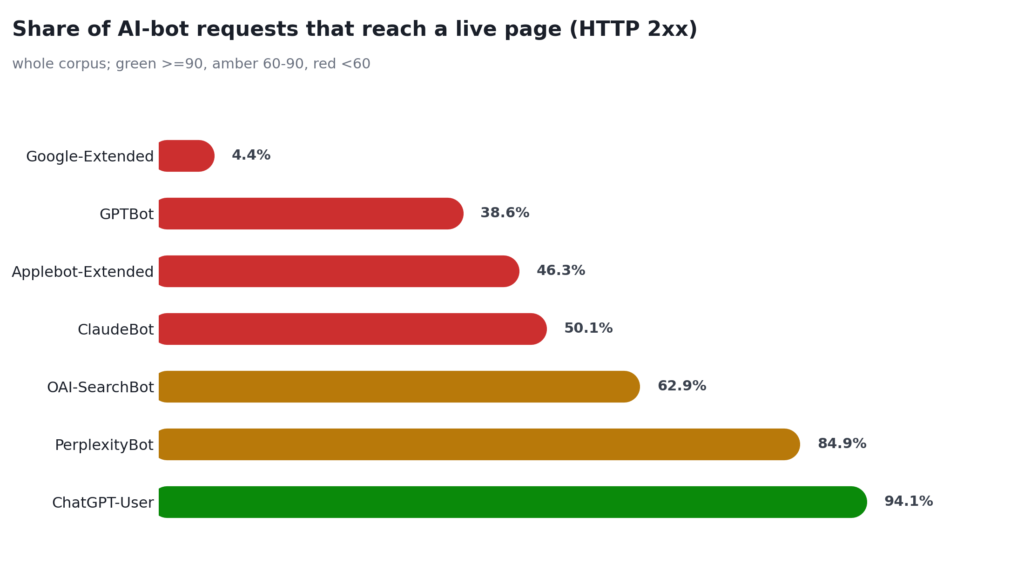
- Between 35.5% and 97.5% of a site’s AI-bot requests reach a live page, depending on the site
- Whole-corpus 2xx shares by bot run ChatGPT-User 94.1%, PerplexityBot 84.9%, OAI-SearchBot 62.9%, ClaudeBot 50.1%, GPTBot 38.6%
- Google-Extended sits at the bottom on 4.4%
GPTBot’s whole-corpus figure is dragged down by our outlier’s redirect wall, and even excluding it the trainer runs roughly 20% non-200. A 5xx block is not crawler mess tolerance either way. It is your server refusing a fetch.
Nobody sees this leak because the tooling is pointed elsewhere. Bot traffic is excluded from analytics by design, and uptime monitors test human paths, not verified-bot paths. A WAF rule that fails an unusual user agent will never trip a dashboard.
The audit itself is an afternoon. Filter your logs to the verified AI crawlers, group by bot and status class, and read the shares:
- A heavy 3xx share means the bot is burning its visit on redirect chains
- A heavy 4xx share means it is being fed dead or blocked paths
- A 5xx share above a few percent means your infrastructure is failing the bot. Escalate that one the same day.
If a bot cannot fetch your page, nothing downstream can happen. No training exposure, no live answer, no citation, no visit.
This audit belongs in every technical SEO review from now on, and it is the first item on our own checklist for preparing your site for AI crawlers.
5. AI Reads Far Beyond Your Google Surface
Your Google top pages are not your AI surface. They are a subset of it. Inventory the content Google never shows, because assistants already read it, and drop any idea of ranking in Google while hiding from AI.
*This is one of our strongest results. It held on every site we tested, with no exceptions anywhere in the portfolio.*
Start with the direction that surprised us. We wrote down a prediction (H4) that AI attention and Google traffic would be weakly coupled, two channels reading different slices of a site.
It failed. The two move together on 8 of 10 sites. But the failure exposed a cleaner, one-directional pattern the original prediction would have hidden:
- On every site we tested, 99.3 to 100% of Google clicks land on pages AI bots also crawl
- We found zero “Google-loved, AI-ignored” pages anywhere in the portfolio
- The reverse is not true. Course pages on P02 drew 15.9k AI-bot requests with zero Google impressions, and the Portuguese locale of C01 drew 33.9k requests with zero Google clicks.
If Google sends traffic to a page, AI systems are reading that page, without exception in our AI crawler data.
Locale variants, tools, archives, generated pages; assistants fetch them all while Google ignores them. That tail is pre-built AI distribution you are almost certainly not maintaining.
Those P02 course pages were being read into answers while earning nothing in search. Their accuracy and freshness mattered even though no SEO report would ever surface them. Content that only an assistant sees still represents your brand every time it gets fetched.
Run the diff on your own logs. Take the set of URLs AI bots fetched last quarter, subtract the set Google surfaced in Search Console, and read what remains.
On our sites, the remainder was locale variants, course libraries, tools, and archives. Curate and update that tail deliberately; it is distribution you already own and are giving to the answer engines in whatever state it happens to be in.
6. Freshness Earns Live-Answer Eligibility
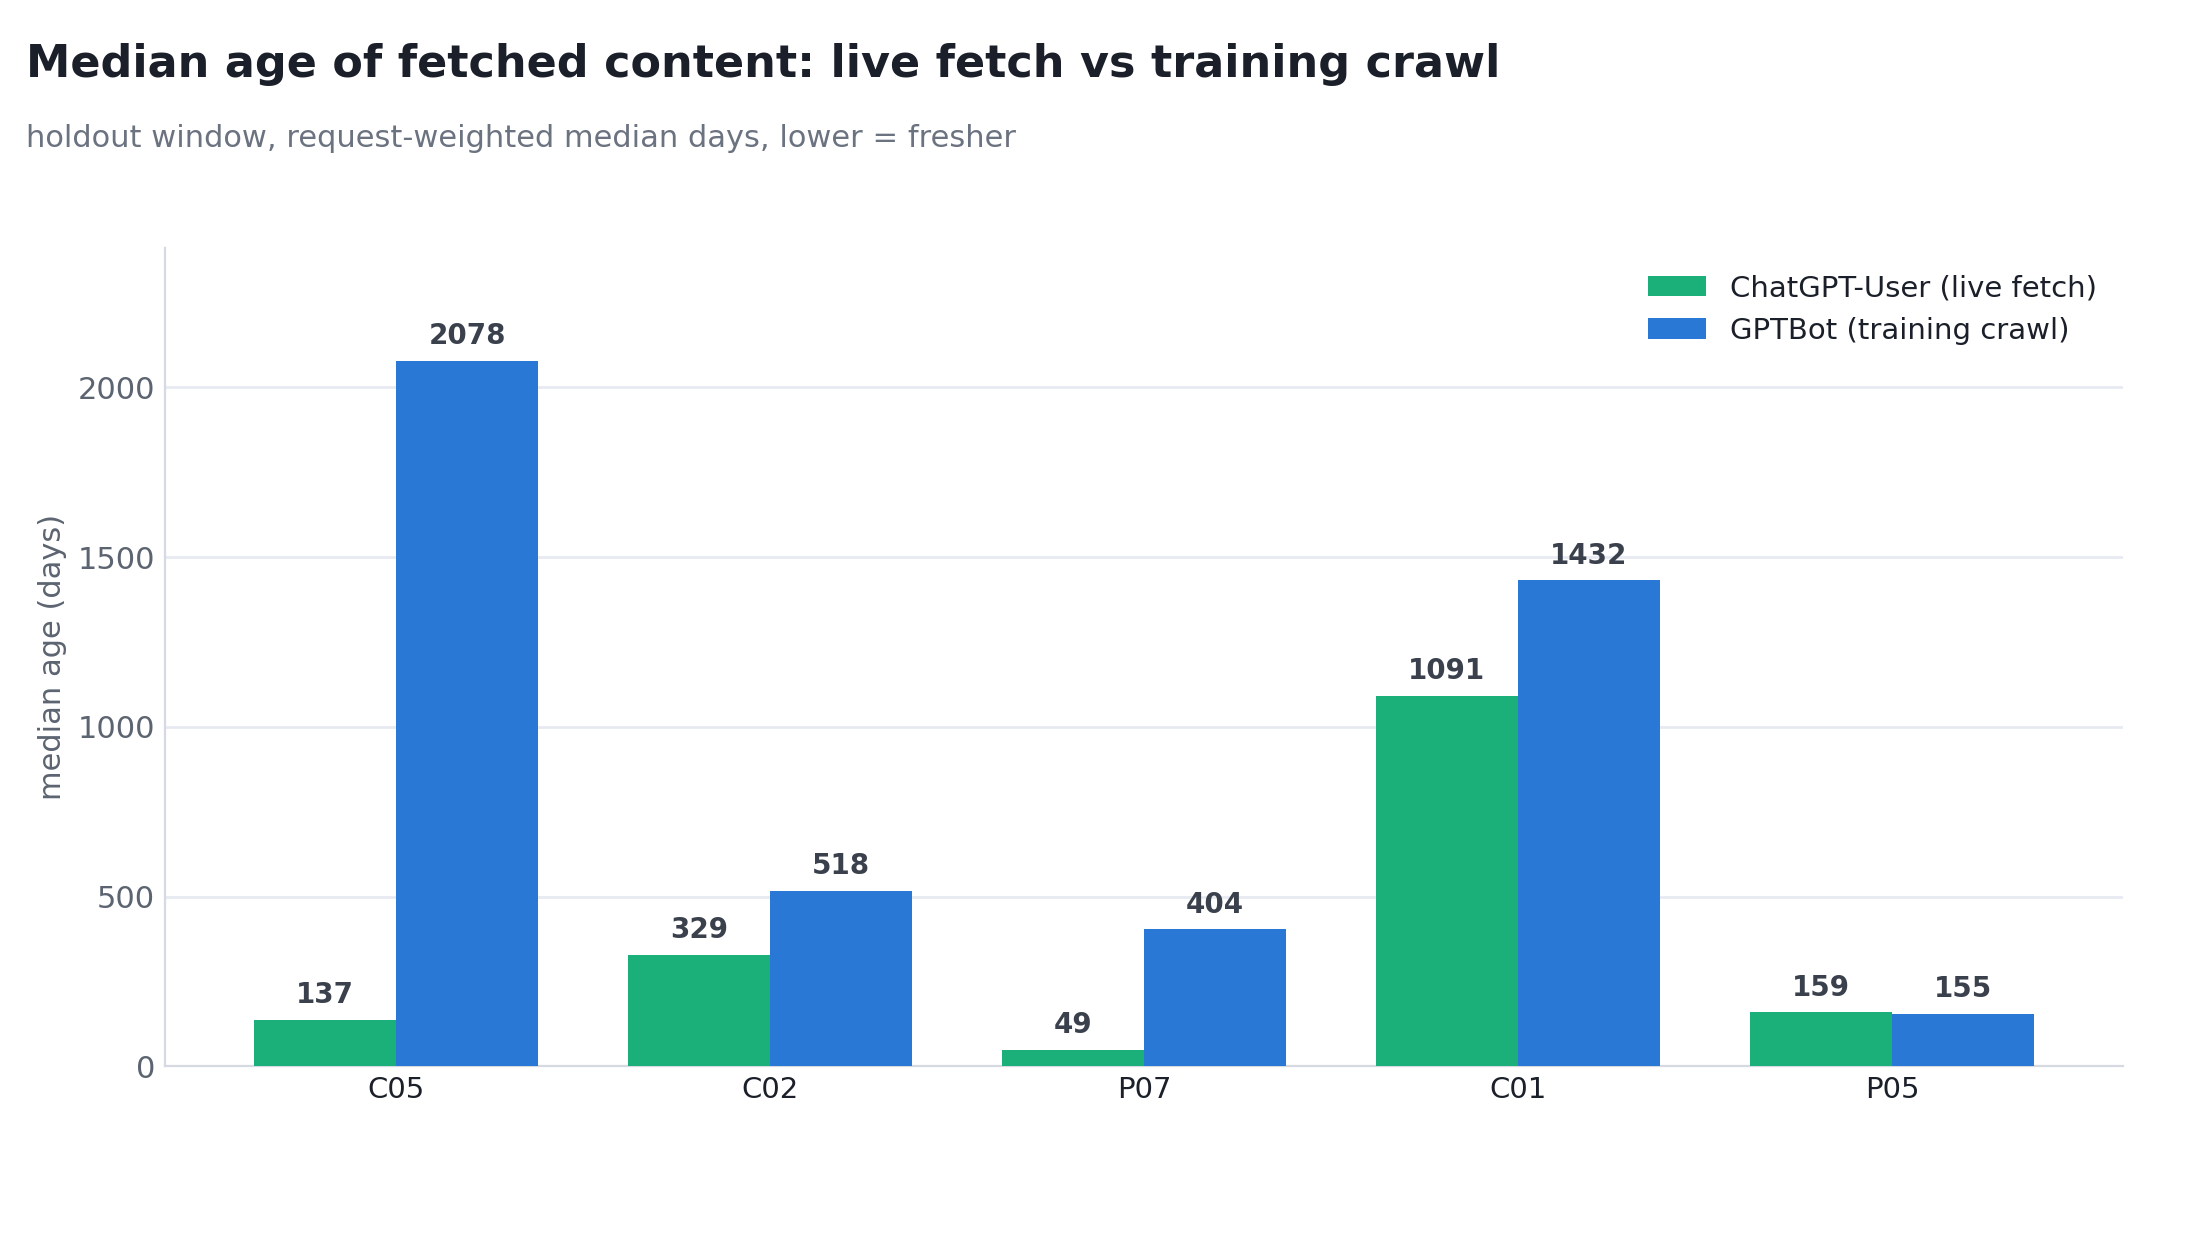
Run a refresh program. Assistants pull recent content into answers, and the age gap between what the live fetcher reads and what the trainer crawls is enormous.
*This is a strong result. We wrote the prediction down before running the numbers, and it held on 4 of 6 sites in both halves of the study.*
The starkest case is C05 in the second half of the study:
- The typical page ChatGPT-User fetched was 137 days old
- The typical page GPTBot crawled was 2,078 days old, nearly six years
- The trainer eats the archive; the live fetcher wants this year’s pages
A consistent early-look pattern sits alongside the confirmed one. AI attention peaks on content 6 to 18 months old and collapses past roughly three years.
On C02, the mid-age posts drew a typical 1,741 requests against 49 for the 3-year-plus posts. We hold that one more loosely; it was not among the predictions we wrote down in advance, but it points the same way on every site we checked.
Connect this to finding 1. Freshness is a retrieval lever, not a training lever.
GPTBot will keep archiving your 2019 posts either way. What freshness changes is whether the live fetcher considers a page worth pulling into an answer today.
The refresh budget your SEO forecast could never quite justify has a measurable AI-side payoff. It accrues to the bot that actually puts pages in front of users.
Prioritize by fetch demand rather than editorial instinct. Sort your library by recent ChatGPT-User requests, find the pages drifting past their attention peak, and refresh those first.
One discipline note. Our data measures real content age, not the modified date stamped on the page. A substantive update that changes what the page says is a refresh; bumping a date on unchanged content is theater, and nothing in this data suggests it works.
Best for libraries with aging evergreen posts that still show live-fetch demand. When a page shows no fetch demand at all, skip the refresh and retire it instead.
7. New Content Is Found in a Day, Except by ClaudeBot
Stop engineering crawl triggers for new posts. Discovery is a solved problem for almost every AI bot, with one named exception worth planning around.
*This is one of our strongest results. It is a straight count on 333 new posts, and the bot ranking is consistent across every content type.*
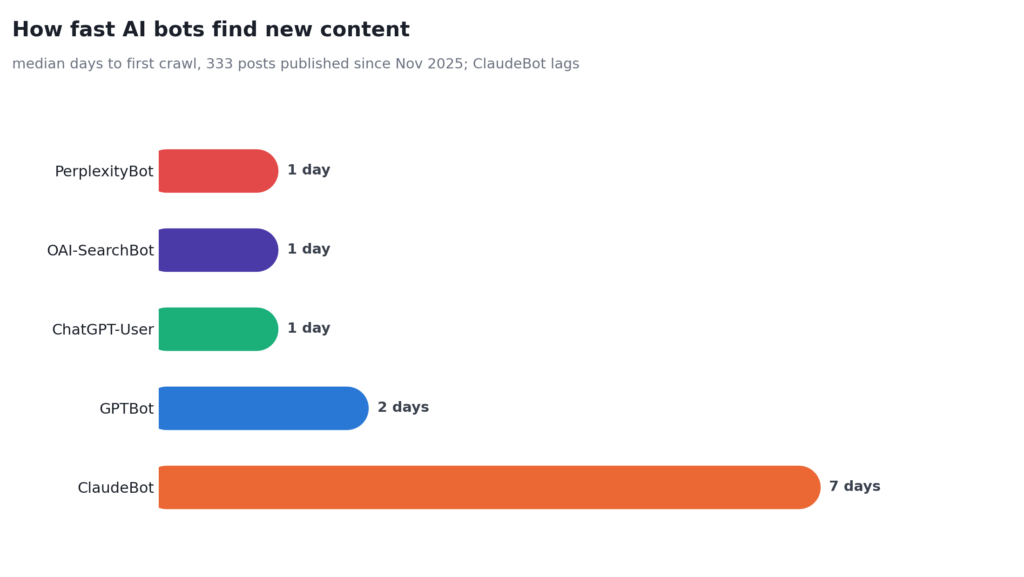
On our cohort of 333 posts published after 2025-11-01, typical time to first crawl was:
- 1 day for ChatGPT-User, OAI-SearchBot, and PerplexityBot
- 2 days for GPTBot
- 7 days for ClaudeBot, often anywhere from 1 to 25 days, and it never crawled 18.6% of the cohort at all
Anthropic’s crawler is both slower to arrive and patchier in coverage than everything else we log.
That settles a worry teams still burn sprint time on. If an AI bot has not touched your new post within a few days, the fix is rarely a discovery trick. Check fetchability and per-bot status codes first (finding 4), because arrival itself is nearly automatic.
Content type barely moves discovery speed. Every major type reached its first crawl within a day for the typical post, and roughly 99% of new pages were eventually crawled by at least one bot.
The differentiation by type shows up in coverage, not speed:
- ChatGPT-User never crawled 29% of new guides, against 3% of new comparisons
- New guides are the likeliest pages to be skipped by the answer bots, which echoes finding 2
- ClaudeBot’s lag is consistent across every type and worst on comparisons, typically 15 days
Two caveats. We could only measure posts published after our logging started, so discovery of older pages is out of view. And the news and research groups were too thin to test, at 6 and 4 posts.
The comparison worth keeping is simple. OpenAI’s fetchers behave like a same-day wire service. Anthropic’s crawler behaves like a weekly digest that skips issues.
Set launch-week expectations accordingly. Same-day eligibility in ChatGPT surfaces; a week or more before Claude’s crawler has even seen the page.
8. Crawl Volume Tracks Google Reach, Not Google Rank
Read AI crawl volume as a reach signal, never as a ranking scorecard. If a heavily crawled page converts nothing, the lever is rank and quality, not more crawl.
*This is one of our strongest results. It was positive on all 10 sites we tested, in both halves of the study.*
Across 10 sites and two separate time periods, the pattern is consistent:
- Pages AI bots crawl more are the pages Google shows more. The link with Google impressions was clear on every site we tested, in both halves of the study.
- The same holds for clicks, positive on 10 of 10 sites
- Against average Google position, the relationship sits near zero and flips direction from site to site
More-crawled pages get shown more and clicked more. They are not reliably ranked higher. The exact figures behind this finding are in the methodology section.
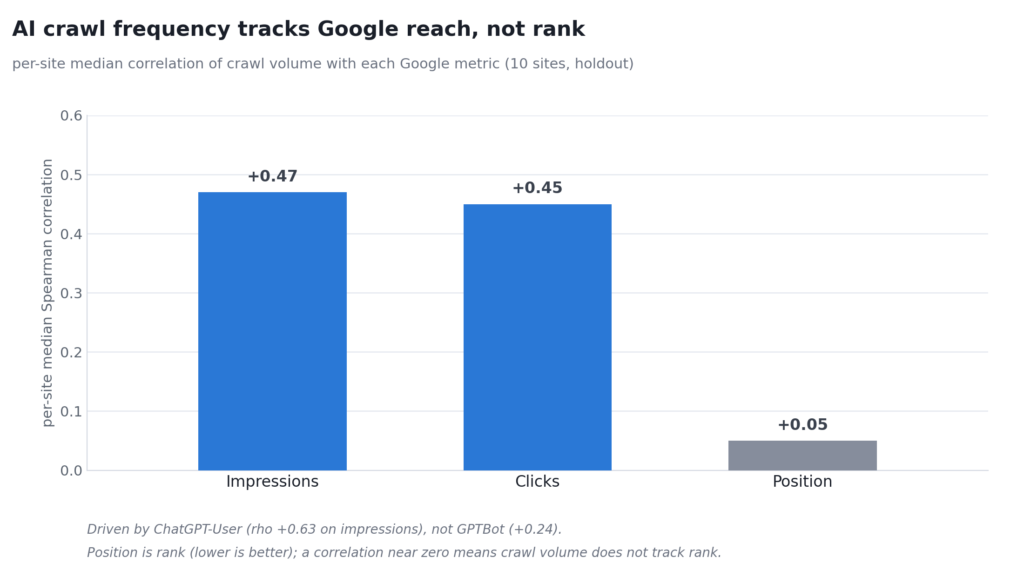
The crawler split is telling. ChatGPT-User moves closely with Google impressions, while GPTBot tracks them far more loosely.
The bot pulled by live human interest moves with the same demand signal Google measures; the trainer sweeps the tail regardless. It is one more way AI search and traditional Google search run on different mechanics while reading the same web.
A structural reading fits the split, and we hold it loosely. Impressions scale with how many queries a page ranks for at all, the same size-and-importance quality that attracts AI crawling. Average position is a per-query measure that a bulky, heavily crawled page can hold while ranking mediocrely across many terms.
These results show association, not cause, and the direction of cause is unresolved. Ranking could drive crawling, or both could track the same underlying page importance. Nothing in this data licenses “get crawled more to rank better,” and we will not pretend otherwise.
The practical read survives the caveat. Crawl frequency tells you how much Google shows a page, not how well it ranks, so diagnose accordingly:
- A high-crawl, low-click page has a rank or intent problem
- A low-crawl, low-impression page has a reach problem
- Those are different fixes
9. Providers Throttle Per Site, Silently: What Happened to T01
AI providers rate-limit individual sites, without notice, and the only way you will know is crawl-volume monitoring. We watched it happen twice to one of our own properties.
*This is one of our strongest results. Both events are dated step changes in our own logs, with 37 untouched sites as the comparison group.*
T01 is a summarization app in our portfolio whose URL-summary pages made it 80% of our entire corpus volume, exactly the profile a provider would eventually throttle. OpenAI did, twice, and both events are dated in our logs:
- First episode, March 4 to 22, 2026. GPTBot volume dropped, held low for nearly three weeks, then snapped back in a day on March 24.
- Between the episodes, the bot hit its all-time peak on the site, 12.1 million requests in April
- Second event, from June 16. GPTBot fell from millions of requests per month to roughly 1.6k per day, and it stayed there. No recovery, no announcement, no email.
Neither event looks like decay or seasonality in the logs. Each is a step function with a date on it.
The comparison group is what turns a mystery into a diagnosis. Across the same weeks, the other 37 zones in the portfolio held steady at roughly 1.3M requests per month combined.
A market-wide change hits every site, and a robots.txt policy change hits on a date you set. What we saw instead was a sharp step in the logs on a known date, while the other 37 sites stayed flat. That is per-site rate limiting, a provider decision made about one property.
Both cutoffs arrived without notice and left no trace except the request counts themselves. Without per-bot, per-site volume monitoring, the June event would have looked like an inexplicable traffic mystery, the kind teams burn weeks investigating in the wrong layer.
With monitoring, it was a dated, diagnosed event with a known cause and a decision to respond to.
Set the alert up now. Watch weekly per-bot request counts per property, and treat a one-site collapse against a flat portfolio as a provider decision you can then investigate, not as fate.
10. Blocking Google-Extended Is Governance Theater
Decide your robots.txt AI policy on the bots that actually visit (OpenAI’s three, ClaudeBot, PerplexityBot). Those five were effectively all of the AI-bot traffic we logged, so they are the entire policy surface that matters.
*This is one of our strongest results. It is a simple count across the full 65.1 million requests.*
Blocking Google-Extended changes almost nothing, because Google-Extended almost never shows up:
- We logged 1,958 Google-Extended requests out of 65.1 million
- 83% of those requests were 4xx anyway
- For scale, ChatGPT-User alone logged 4.9 million requests on the non-outlier portfolio in the same window
The bot people spend meetings debating barely cleared two thousand.
One measurement note belongs beside that. Cloudflare only classified Google-Extended from 2026-04-14, so part of its near-absence reflects the classification start date. Even in the fully classified months, it stays at 0.05% of AI-bot traffic.
The bot it supposedly protects you from does not use it either. Google’s AI Overviews fetch content via ordinary Googlebot, which Google-Extended does not control.
We broke down how Google AI Mode and AI Overviews actually fetch and cite content separately. The short version is that opting out of Google-Extended does not opt you out of AI answers.
One appendix stat doubles as disclosure. Across all 38 sites and 65.1 million requests, exactly zero AI-bot requests were blocked or challenged.
These are our own sites, so read that as our stance made visible rather than a market survey. We run the portfolio wide open, and every finding above is what that access buys.
The Mostash position. Spend your robots.txt time on access hygiene, because that is enforced. Treat AI-policy directives as statements of intent, not shields. Your policy debate should name the bots in your logs, and a directive aimed at a bot that never visits is governance theater.
11. Depth and Data Density Get Read More (Directionally)
Bias your publishing toward substantial, data-dense pages. It is why this article ships with ten charts and an open dataset.
*Treat this one as directional. It held on 4 of 6 sites, and the effect was about four times stronger on one site than the other.*
“Structured content wins” gets claimed everywhere and measured almost nowhere, so we will show you exactly how strong this evidence is.
We wrote the prediction down before running the numbers (H1). Pages with data tables would draw more AI-bot requests per page, after accounting for page age and Google impressions. It confirmed at our bar, and it is also honestly fragile:
- The direction held on 4 of 6 sites in the second half of the study
- Only our two largest sites held in both halves, and the effect was about four times stronger on C01 than on C02
- Two of the small sites barely have table-free pages to compare against
The exact model figures are in the methodology section.
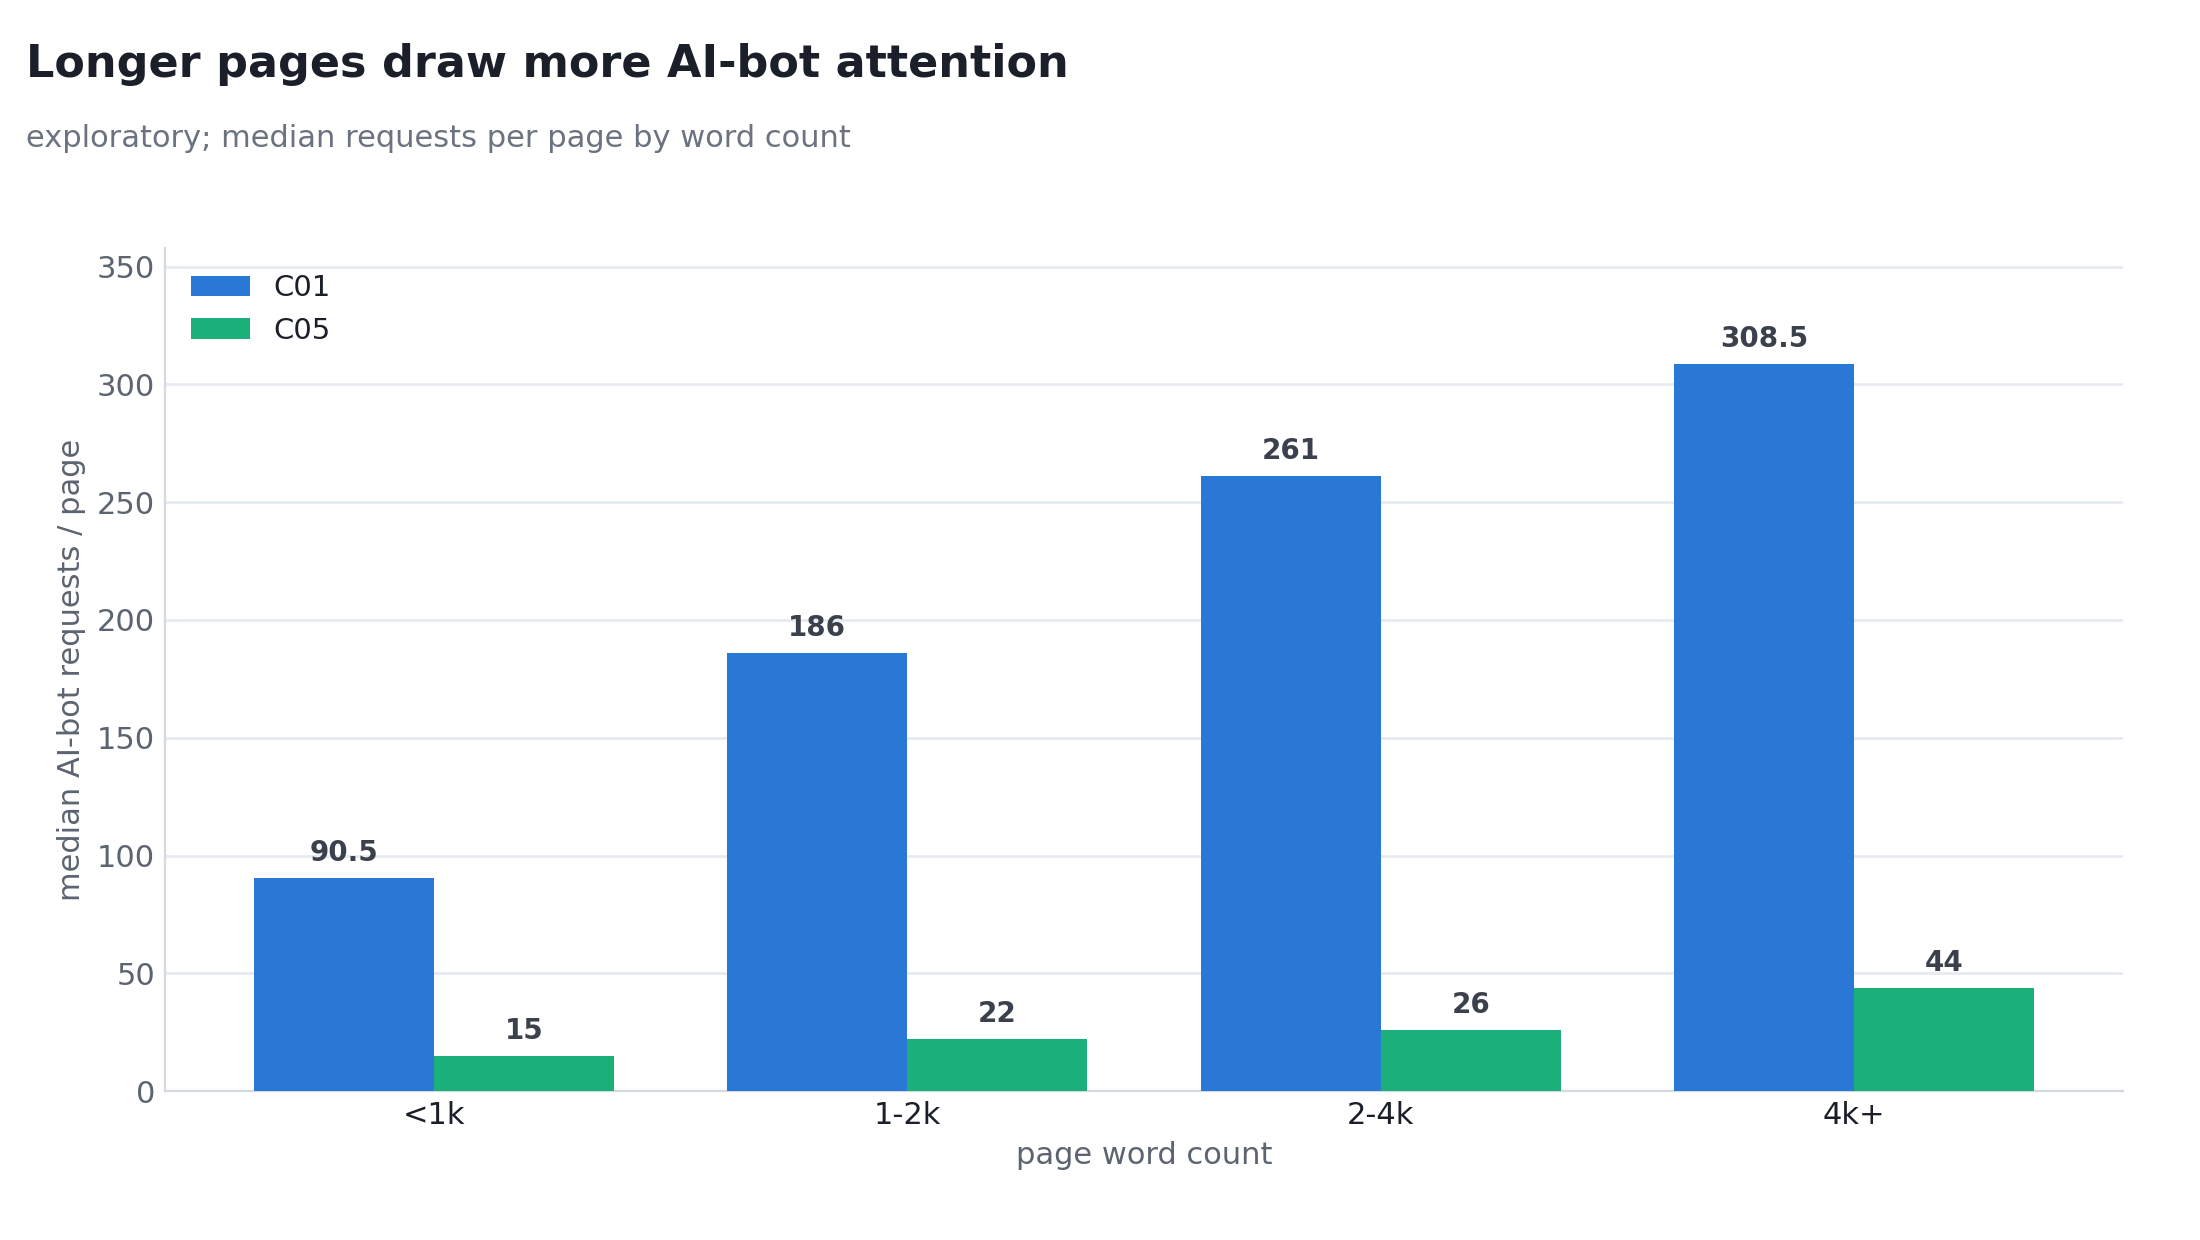
The cleaner early-look pattern is the word-count gradient. The typical page earns more AI-bot requests at every step up in word count:
- On C01, the typical page climbs from 90.5 requests in the under-1k-word band to 308.5 in the 4k-plus band
- On C05, from 15 to 44
Fragile means exactly this. Had we run the study on our four smaller sites alone, we could not have published the table effect at all. Anyone selling a universal “add tables, get crawled” rule is claiming a precision our 65 million requests cannot support.
We publish this as directionally supported, never as a law. This section deliberately demonstrates the difference between what our data can claim and what it cannot.
That is the same standard you should demand from any list of AI search visibility factors, and the same honesty we apply to structured data’s role in AEO.
Best for pillar pages where a real comparison table earns its place. Skip padding word count for its own sake; in our data, length correlates with substance, it does not substitute for it.
How We Measured: 65.1M Requests, Pre-Registered Hypotheses, Two Windows
Every number above traces to the method below, so disputes have somewhere to look. This is also where the phrase “AI crawler statistics” earns its meaning; a statistic without a visible method is a rumor with a decimal point.
The sample
65,116,344 AI-bot requests across 38 websites, logged from 2025-10-17 to 2026-07-07. Every request comes from Cloudflare’s verified-bot classification, covering seven crawlers (GPTBot, ChatGPT-User, OAI-SearchBot, ClaudeBot, PerplexityBot, Google-Extended, Applebot-Extended). Per-page joined analysis ran on 12 sites, content attributes (publish date, word count, tables, format) came from the WordPress REST API on 10 sites, and the Google side came from Search Console across 25 properties.
The design
This is an observational census plus correlational joins. No causal claims appear anywhere in this piece, and none are licensed by the data. Two quasi-experimental reads were allowed because each has a comparison group; the T01 throttling event (the other 37 zones are the control) and the Google-Extended classification start (handled as a measurement artifact, not a behavior change).
Descriptive claims had to pass three robustness rules:
- reported with and without T01 (80% of raw volume)
- per-site median shown alongside pooled totals
- stable across months, with no claim that flips sign quarter to quarter
Relational claims were pre-registered before the join analyses ran, estimated on an exploration window (2025-10-17 to 2026-03-31), then confirmed or failed on a holdout window (2026-04-01 to 2026-07-06). Whatever failed the holdout is reported as failed, not softened into the narrative. The next section is the proof.
| Hypothesis | Prediction | Verdict |
|---|---|---|
| H1 | Pages with data tables draw more AI-bot requests, controlling for age and impressions | Confirmed at the bar (4 of 6 holdout sites), honestly fragile |
| H2 | ChatGPT-User fetches younger content than GPTBot | Confirmed on 4 of 6 sites, both windows |
| H3 | More OAI-SearchBot and ClaudeBot crawl predicts more Copilot citations | Untestable, no citation feed exists |
| H4 | AI attention and Google clicks are only weakly coupled | Failed; coupling is moderate to strong on 8 of 10 sites |
| H5 | ChatGPT-User carries dirtier traffic than GPTBot | Reversed; the training crawler carries the dirty traffic |
Source: our pre-registered study design and first-party analysis.
Content classification
2,703 posts across six sites were classified by content type using a two-LLM pipeline with roughly 94% agreement between the models. Disagreements cluster at the type boundaries (guide, comparison, review) and add noise rather than bias at the scale of the gaps we report.
The exact statistics
The body states these results in plain words; here are the estimates behind them.
- Crawl vs Google (finding 8). Per-site median Spearman correlations of per-URL AI crawl frequency against Google impressions were +0.564 (exploration) and +0.470 (holdout); against clicks, +0.617 and +0.452; against average position, the pooled median sits near 0 with sign flips between sites.
- Per-bot split (finding 8). Median per-site Spearman correlations with Google impressions were +0.73 (exploration) and +0.63 (holdout) for ChatGPT-User, against +0.29 and +0.24 for GPTBot.
- Tables effect (finding 11, H1). Regression coefficients for the presence of data tables, with page age and Google impressions as controls, were +0.45 on C01 and +0.11 on C02, the two sites that held in both windows.
- Freshness (finding 6, H2). Request-weighted median content age in the C05 holdout was 137 days for ChatGPT-User against 2,078 days for GPTBot.
- Discovery (finding 7). ClaudeBot’s median time to first crawl was 7 days with an interquartile range of 1 to 25 days on the 333-post cohort.
Limitations, stated plainly
- One operator’s portfolio; 38 sites, heavily skewed, with T01 alone at 80% of volume, so every average is reported with and without it.
- The site mix skews English-language SaaS and content sites; this is not a web-wide sample.
- The instrument is Cloudflare’s verified-bot classification; bots that evade it are invisible to us, and AI crawlers outside the seven-bot taxonomy above are out of scope.
- Google-Extended was only classified from 2026-04-14, and AI Overviews fetch via ordinary Googlebot, which this dataset does not capture.
- No AI platform exposes a per-URL citation feed, so the crawl-to-citation join is the study’s known gap.
- Classification noise of roughly 6% affects content-type boundaries.
Corrections and the dataset
If a number on this page changes, a dated correction lands here, in this section, and the URL of this page stays frozen. The aggregated data behind the piece (5 CSVs plus JSON-LD) is open under CC BY 4.0. Cite it as Mostash (2026), AI Crawler Behavior Dataset.
What Did Not Hold: the Headlines We Killed
A benchmark earns trust by what it refuses to publish. Before this piece went out, we ran every candidate headline through the robustness rules and both halves of the study, and tried to kill it. These are the ones that died, and what replaced them.
“OpenAI crawls your site 11x more than it reads it.” Killed. The 11:1 pooled ratio is real arithmetic and a broken conclusion. It is T01 alone, running at 736 training crawls per live read. The typical content site sits near 1:1, and several of ours take 10 to 25 reads per crawl. Finding 1 is what survived the check.
“Up to 65% of AI crawler requests hit dead URLs.” Killed. The real 404 share across the corpus is 0.22%. smmry’s non-200 mass is redirects, not dead pages. The honest replacement is the 5xx and redirect waste in finding 4, which is smaller, fixable, and actually yours to act on.
H5 reversed. We predicted in advance, in writing, that ChatGPT-User would carry dirtier traffic than GPTBot, on the logic that users make assistants chase stale and hallucinated URLs. The opposite held, in both halves of the study. GPTBot runs at roughly 20% non-200 excluding smmry, while ChatGPT-User runs 94 to 97% clean. A written-down prediction that comes out backwards is rare and unusually trustworthy, which is exactly why we publish it rather than quietly reframing it.
H4 failed as written. We predicted AI reading and Google clicks would be weakly coupled. They are not; the two move together on 8 of 10 sites. The honest replacement is finding 5’s one-directional pattern. AI reads beyond your Google surface, and Google never sends traffic where AI does not read.
H3 untestable. Crawl-to-citation needs a citation feed, and none exists. Bing’s AI Performance report has no API (we probed every candidate endpoint), and neither ChatGPT nor Perplexity exports per-URL citations. Until a platform ships that feed, every crawl-to-citation claim you read anywhere is inference. This is the field’s biggest measurement gap, and it is our stated follow-up.
The next time a stat from this list surfaces in a vendor deck, you will know where it came from and why it is wrong.
The Bottom Line
AI visibility in 2026 is a retrieval problem. Not an unmeasurable citations mystery, and not a training-data lottery you wait years to win.
The sites that win are the ones the live-fetch bot can reach, reads often, and reads fresh. Every one of those three verbs is measurable in your own logs this week. Everything else in this study is detail on them.
Compressed into a runnable order, from the eleven findings above:
- Segment ChatGPT-User in your server or CDN logs and make it your AI-visibility KPI.
- Run the per-bot status-code audit and fix the 5xx and redirect leaks.
- Ship comparison-format content, and free indexable tools where they fit your product.
- Refresh the pages the fetchers already pull; retire the ones they never ask for.
- Inventory the AI-only tail Google ignores, and set per-bot crawl-volume alerts per property.
The first two cost nothing but log access, and they are where our own portfolio was leaking.
The data is yours to check. The aggregated dataset behind this piece (5 CSVs plus JSON-LD) is free to download from our dataset page under CC BY 4.0, no gating, no email wall. Cite it as Mostash (2026), AI Crawler Behavior Dataset.
This page now enters its own experiment. We will report whether AI systems crawl, fetch, and cite it, measured with the same instrument that produced everything above.
And if you would rather have this audit run on your logs than read about ours, that is the work we do at Mostash.
Frequently Asked Questions
How often does GPTBot crawl a website?
On our portfolio, GPTBot accounted for roughly 3.6 million of 13 million non-outlier AI-bot requests over about nine months, and its frequency varied by orders of magnitude between sites. It reached new posts in a typical 2 days. There is no useful universal average, so per-site log monitoring beats any published benchmark figure, including ours. Provider behavior differs per property and can change without notice, as our own throttling event showed.
What is the difference between GPTBot and ChatGPT-User?
ChatGPT-User ran at 94 to 97% successful (2xx) requests in our logs and grew from 377k to 609k monthly requests between March and May 2026, while GPTBot, the bulk training crawler, failed roughly 20% of its non-outlier requests. GPTBot collects pages to train future models. ChatGPT-User fetches a page live, at the moment a real user asks ChatGPT something that page can answer. The live fetcher is the visibility signal worth tracking.
Should I block AI crawlers?
That is your policy call, but across 65.1 million requests on our 38 sites we deliberately blocked or challenged exactly zero AI-bot requests, and this study is what that open stance measured. Blocking remains a legitimate choice for your content; know the mechanics before you decide. Google’s AI Overviews fetch via ordinary Googlebot, so blocking Google-Extended does not opt you out of AI answers; it only signals intent to a bot that barely visits (1,958 requests in our whole corpus).
How fast do AI bots find new content?
Typical time to first crawl of a new post was 1 day for ChatGPT-User, OAI-SearchBot, and PerplexityBot, 2 days for GPTBot, and 7 days for ClaudeBot in our 333-post cohort. ClaudeBot also never crawled 18.6% of new posts at all. Content type barely affected speed; every major type was reached within a day for the typical post. Discovery is effectively solved for OpenAI’s and Perplexity’s bots; only Anthropic’s crawler is slow and patchy enough to plan around.
Does AI crawling improve Google rankings?
Across the 10 sites we tested, in both halves of the study, AI crawl volume showed no relationship with Google average position; the link sat near zero and flipped direction between sites. Crawl volume does track Google impressions and clicks, positive on 10 of 10 sites, but that is a reach association, not cause, and the direction of cause is unresolved. Nothing in our data supports crawling more as a way to rank better.
Where can I download the AI crawler dataset?
The full dataset (5 CSVs plus JSON-LD) is free to use under CC BY 4.0, with no gating. Cite it as Mostash (2026), AI Crawler Behavior Dataset. It covers 65,116,344 requests and includes per-crawler totals, monthly volumes, content freshness by bot, word-count attention bands, and per-site figures for every site above 10k requests. The URL is frozen, so every number stays quotable.


